


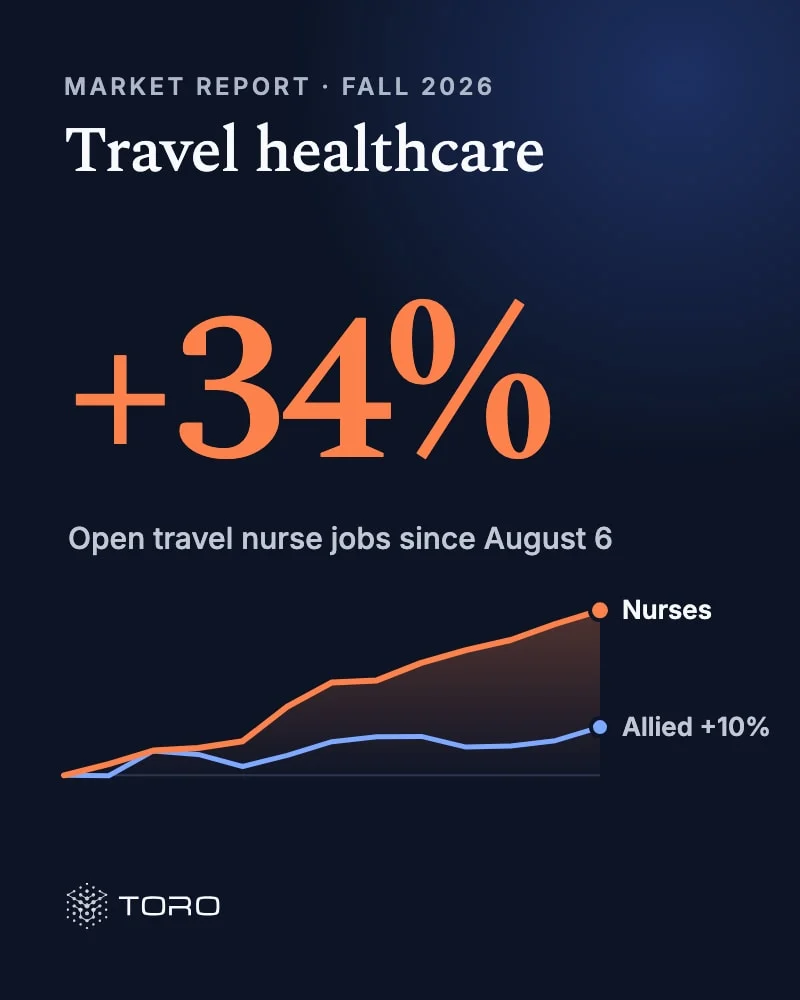
Every week since August 6, 2026, Toro has read the public job boards of national healthcare staffing firms, classified every posting by discipline, unit and location, and tracked each job from the week it appears to the week it comes down. Here are four things to know about the fall market, previewed from our full report.
How we count an open job
One order for several nurses is often advertised many times, sometimes 10 to 100 identical ads. Counting raw postings would overstate the market. We count each agency's ads for the same discipline, unit and city in a week as one open job, so ten identical ads for one ICU order in Phoenix count once. When several agencies advertise the same order, each agency's listing counts, so these figures track how much agencies are advertising, not unique hospital orders. Each week-to-week change uses only agencies whose collection was complete in both weeks, and the changes are chained. Travel contracts only; no firm is named.
Nurses are carrying the fall surge
Open travel nurse jobs are up 34% since Aug 6. Open jobs for techs, therapists, pharmacy and lab are up 10%. Nurses account for 80% of the net growth.
August was close to flat. The climb steepened after Labor Day: open nurse jobs are up 25% since September 1 alone, and they rose every single week.
| Aug 6 | 0% | 0% | 0% |
| Aug 11 | +2% | 0% | +1% |
| Aug 18 | +5% | +5% | +5% |
| Aug 25 | +6% | +4% | +5% |
| Sep 1 | +7% | +2% | +4% |
| Sep 8 | +14% | +4% | +9% |
| Sep 15 | +19% | +7% | +13% |
| Sep 22 | +20% | +8% | +13% |
| Sep 29 | +23% | +8% | +15% |
| Oct 6 | +26% | +6% | +15% |
| Oct 13 | +28% | +6% | +16% |
| Oct 20 | +31% | +7% | +18% |
| Oct 27 | +34% | +10% | +21% |
Source: Toro analysis of public U.S. healthcare staffing job postings.
Pediatric and critical care lead
PICU openings are up 147%, general pediatrics +168%, ER +67% and ICU +43%.
Since September 1, NICU (+7%) and mother-baby (+5%) have barely moved, and labor & delivery (+12%) trails the nurse average (+25%). The ER, telemetry and step-down, ICU and med-surg together hold 49% of open travel nurse jobs, so their growth moves the total most. PICU and pediatrics are small books growing very fast.
| Pediatrics | 1.1% | +168% | +103% |
| PICU | 1.7% | +147% | +70% |
| Emergency (ER) | 15% | +67% | +44% |
| Tele / PCU / step-down | 12% | +44% | +31% |
| ICU / critical care | 11% | +43% | +37% |
| Med-surg | 11% | +34% | +25% |
| Labor & delivery | 9.3% | +18% | +12% |
| Operating room | 9.3% | +17% | +17% |
Orange marks PICU and general pediatrics, small books growing fastest. Hover a bar for growth since September 1 and the unit's share. The full report covers every unit with at least 1% of open nurse jobs.
Source: Toro analysis of public U.S. healthcare staffing job postings.
The West Coast leads the big markets, and the snowbird states took turns
Open travel nurse jobs rose in every one of the 45 states with enough postings to measure. Among the larger markets (at least 2% of open nurse jobs), the biggest moves are on the West Coast: Washington +99%, California +89%, Oregon +84%.
Arizona's rise came early: open nurse jobs climbed 31% from early August to late September, then went flat in October (0%). Florida's came late: +24% through September, then +32% in October alone.
Dashed tiles: too few postings to measure growth.
| California | 9.9% | +89% |
| Texas | 7.2% | +54% |
| Massachusetts | 4.1% | +28% |
| North Carolina | 3.8% | +6% |
| Virginia | 3.5% | +46% |
| Illinois | 3.5% | +20% |
| Colorado | 3.4% | +33% |
| Washington | 3.3% | +99% |
| Georgia | 3.3% | +25% |
| New York | 3.2% | +30% |
| Ohio | 3.1% | +16% |
| Arizona | 2.8% | +30% |
| Wisconsin | 2.6% | +19% |
| Missouri | 2.5% | +57% |
| Tennessee | 2.5% | +18% |
| Michigan | 2.5% | +25% |
| Florida | 2.5% | +64% |
| Iowa | 2.4% | +4% |
| Indiana | 2.1% | +19% |
| Oregon | 2.1% | +84% |
| Pennsylvania | 2.0% | +22% |
| Kentucky | 1.6% | +14% |
| Kansas | 1.5% | +13% |
| Maryland | 1.5% | +58% |
| New Hampshire | 1.5% | +12% |
| Maine | 1.4% | +61% |
| South Carolina | 1.4% | +4% |
| Oklahoma | 1.4% | +4% |
| New Mexico | 1.3% | +3% |
| Minnesota | 1.2% | +25% |
| Connecticut | 1.2% | +27% |
| West Virginia | 1.2% | +75% |
| Alabama | 1.1% | +8% |
| New Jersey | 1.1% | +28% |
| Nebraska | 1.1% | +30% |
| Louisiana | 1.0% | +66% |
| North Dakota | 0.9% | +69% |
| Montana | 0.9% | +11% |
| Vermont | 0.9% | +129% |
| South Dakota | 0.8% | +54% |
| Arkansas | 0.7% | +21% |
| Alaska | 0.7% | +54% |
| Hawaii | 0.6% | +5% |
| Idaho | 0.6% | +1% |
| Mississippi | 0.5% | +24% |
| Nevada | 0.3% | — |
| Wyoming | 0.3% | — |
| District of Columbia | 0.3% | — |
| Rhode Island | 0.3% | — |
| Utah | 0.2% | — |
| Delaware | 0.2% | — |
Source: Toro analysis of public U.S. healthcare staffing job postings.
Half of new jobs come down within two weeks
We follow each posting from the week it first appears. 34% of new travel postings come down within a week, 52% within two weeks and 72% within four.
Nurse jobs are lingering a little longer. “Taken down” usually means filled, but it can also mean cancelled or reposted, so treat these as the speed of the market rather than a fill rate.
What else is in the full report
The full edition runs eleven chapters and more than 30 charts, each with a table view.
- The surge, measured. Five ways of counting, how much of the rise is new orders versus jobs staying up longer, and an outside check against Indeed.
- Disciplines. Which allied disciplines are growing fastest, and which large books are holding the allied total down.
- Nursing units. Growth across nursing units and allied specialties, and the largest units week by week.
- Geography. The full state table, the largest markets week by week, how concentrated growth is by city, and the licensure-compact picture.
- Fill speed. How fast jobs come down by unit, discipline and state, and which jobs are hardest to fill.
- Pay levels. Advertised weekly pay by discipline, unit and state, and the best-paid unit per hour. It isn't the ER.
- Pay movement. Has advertised pay kept up with openings? How often open jobs get a raise, and how often a cut.
- Price and speed. How pricing against the local rate changes how long a job stays posted, and which jobs get raises.
- What orders look like. Contract length, hours, shifts, start dates and facility types for nurse and allied orders.
- Competition. How many agencies advertise the same unit in the same city, and how that is changing.
- What it means. Six moves for staffing leaders heading into 2027, each tied to a number in the report.
Want the rest of the picture, including pay?
Request it below and the Toro team will send you the full report.
Source: Toro analysis of public U.S. healthcare staffing job postings, August 6 – October 27, 2026.